Executive discussions regarding artificial intelligence tend to focus heavily on immediate efficiency gains. However, long-term market survival requires looking at a much harsher reality: structural market share erosion. Staying competitive in a fast-evolving economy comes down to understanding how to use ai for small business growth, or facing what your company structurally loses by delaying integration.
This analysis bypasses speculative theories to deliver a multi-year operational and revenue roadmap across the next 36 months. It provides a precise framework for small to medium-sized business owners mapping out critical investment timelines.
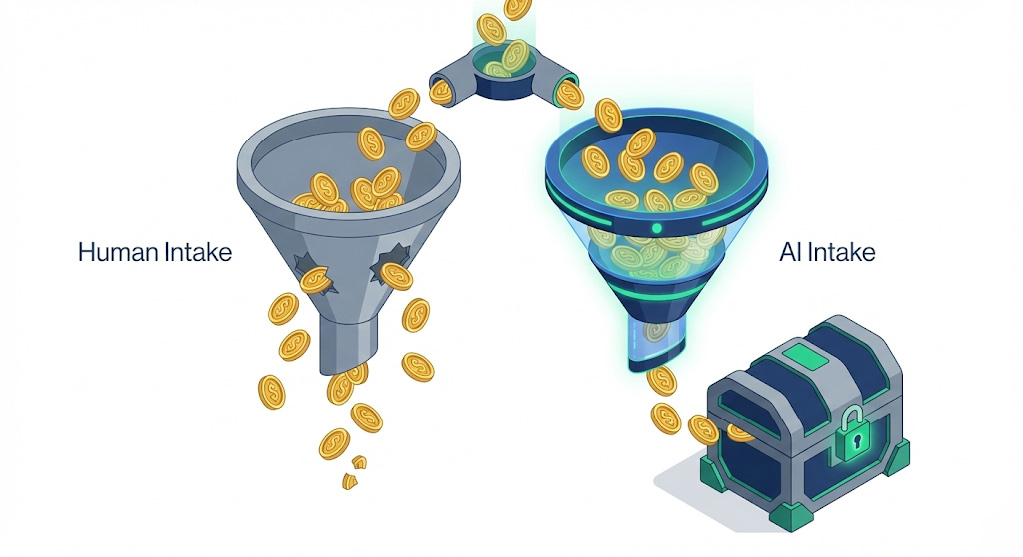
The competitive divergence triggered by missing out on modern automation technology compounds exponentially. Every month your business operates on manual workflows and expands a dangerous data and visibility gap between you and your automated peers.
| The Operational Divide: The productivity and visibility gap between automated corporate systems and legacy manual setups widens rapidly across global industries. |
Where We Are Right Now: The State of Play
Artificial intelligence has officially crossed the chasm from an experimental marketing edge into core infrastructure. Industry benchmarks indicate that approximately 87% of scaling firms deploy generative systems within at least one operational workflow.
Furthermore, macroeconomic research highlights that global spending on automated enterprise frameworks exceeded $57.99 billion. This surge is heavily driven by small to medium-sized operations standardizing specialized algorithms to manage workflows.
Global AI Enterprise Software Market Scale:
2025: $47.32 Billion
2026: $57.99 Billion (Projected)
Consumer behavior has shifted alongside internal business processes. Large language models and conversational networks now capture hundreds of millions of weekly active users seeking direct consumer solutions.
This environment makes adoption uneven across small and medium-sized enterprises (SMEs). Organizations that integrated functional workflows early are currently realizing compounding returns on data intelligence.
Conversely, operators relying on traditional legacy methods are not holding a steady baseline. They face accelerating customer acquisition costs and diminished search equity. Navigating the next 12, 24, and 36 months requires assessing this friction point directly.
Year 1: The Visibility Gap Opens
The primary penalty for failing to execute a modern digital strategy manifests as a breakdown in organic search engine visibility and consumer discovery.
The Shift to Answer Engine Optimization (AEO)
Modern search behavior leans heavily toward automated answer engines like Google AI Overviews, OpenAI solutions, and Perplexity. Platforms are increasingly capturing informational queries that historically triggered high-intent website clicks for local operators.
AI Overview Deployment Rate (US Queries):
[████████████████████] 48% of all digital searches
These analytical systems curate responses strictly from digital content optimized for algorithmic extraction. This requires logical document hierarchies, structured schemas, clear information tables, and authoritative factual patterns. Legacy articles lacking this explicit formatting disappear from conversational indexes.
Traditional SEO vs. Answer Engine Optimization (AEO):
┌───────────────────────────────┬───────────────────────────────┐
│ Legacy Digital Formats │ Next-Gen AEO Formats │
├───────────────────────────────┼───────────────────────────────┤
│ • Unstructured text walls │ • Bulleted data extraction │
│ • Keyword-stuffed headings │ • Direct semantic headers │
│ • Long, vague prose blocks │ • Intent-focused question Q&As│
└───────────────────────────────┴───────────────────────────────┘
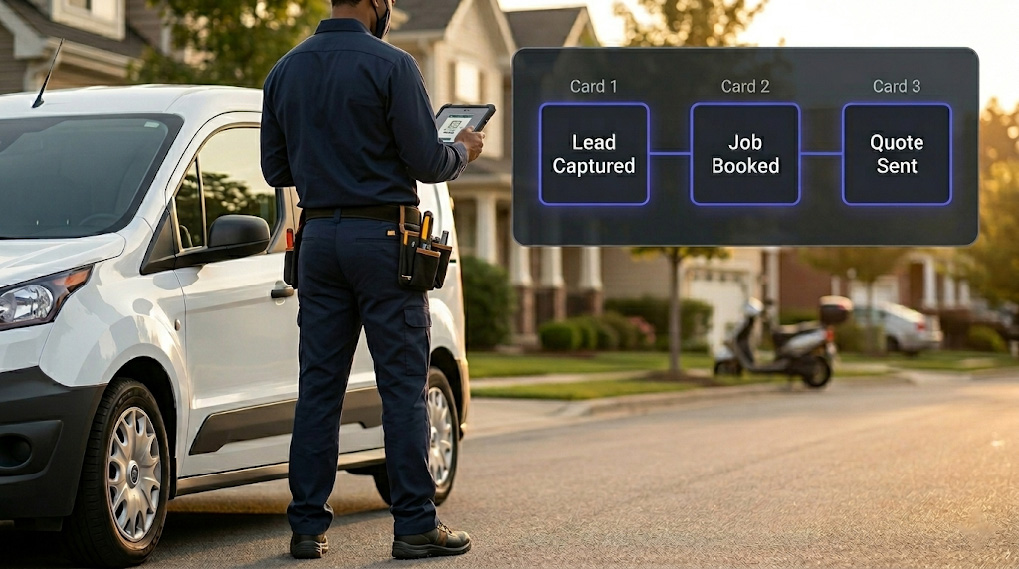
This structural shift transforms lead generation loops. For instance, when a commercial real estate agent or property client queries an engine to locate specific portfolio opportunities, the algorithm extracts details from structured directories. If your digital footprint lacks proper indexation tags, your business simply misses the consideration pool.
The Speed-to-Lead Response Crisis
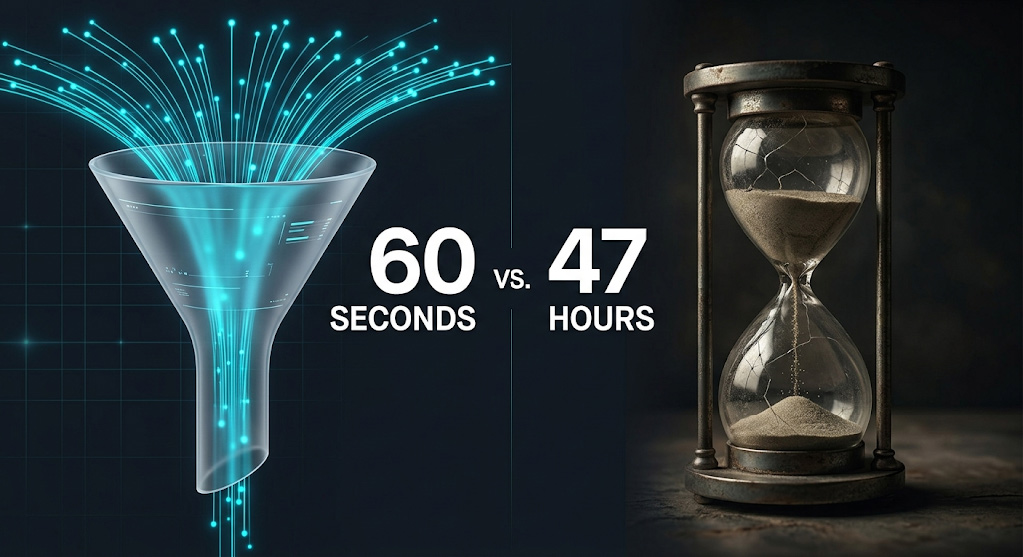
Simultaneously, the communication speed gap widens drastically. Firms utilizing advanced operational platforms capture and route inbound customer inquiries within 60 seconds.
Average Customer Inquiry Response Latency:
Automated Workflows: █ 60 Seconds
Manual Standard: ██████████████████████████████ 29 to 47 Hours
A manual response architecture lagging by hours cannot compete for conversion metrics when buyer intent is at its highest point. This structural operational delay leaves a business deeply exposed to customer churn.
Expected Milestones of Delayed Adoption (End of Year 1)
- Organic Footprint Atrophy: Inbound organic referral traffic declines as conversational text answer blocks take up prime top-of-page real estate on mobile and desktop viewports.
- Elevated Acquisition Expense: Customer acquisition costs spike across paid digital search and auction channels due to heavier reliance on paid bids to replace lost organic visibility.
- Onboarding Friction: Legacy service models continue utilizing multi-week agency setups, causing major delays in go-to-market agility compared to immediate systemic deployment.
Year 2: The Operations Gap Compounds
By the second year of non-adoption, the competitive friction moves from outward-facing lead discovery directly into deep internal business operations.
Data Accumulation and Machine Learning Capital
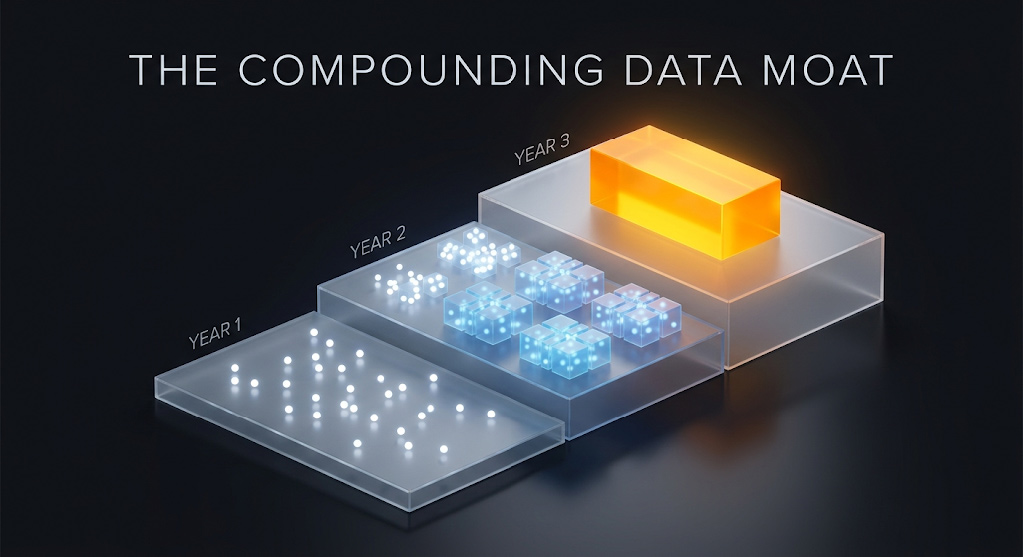
Firms that deployed systemic internal frameworks early possess 12 to 24 months of clean, proprietary workflow data. This operational feedback loop functions like compound interest for business efficiency.
The Compounding Operational Data Funnel:
Raw Workflow Execution ──> Machine Learning Capture ──> Asset Optimization ──> Multiplied Output
Automated systems track which precise leads generate optimal conversion paths, which distribution channels minimize overhead, and which follow-up steps produce long-term retention. This enables automated competitors to allocate resources with exceptional precision.
The Hidden Financial Toll of Legacy Overhead
Firms clinging to entirely manual business operations spend identical capital and labor hours to realize progressively smaller market returns. This dynamic manifests as a sharp contrast in daily operational capacity:
Workflow Comparison Matrix (Year 2 Maturity)
| Core Business Function | Manual Legacy Operations | AI-Driven Automated Systems |
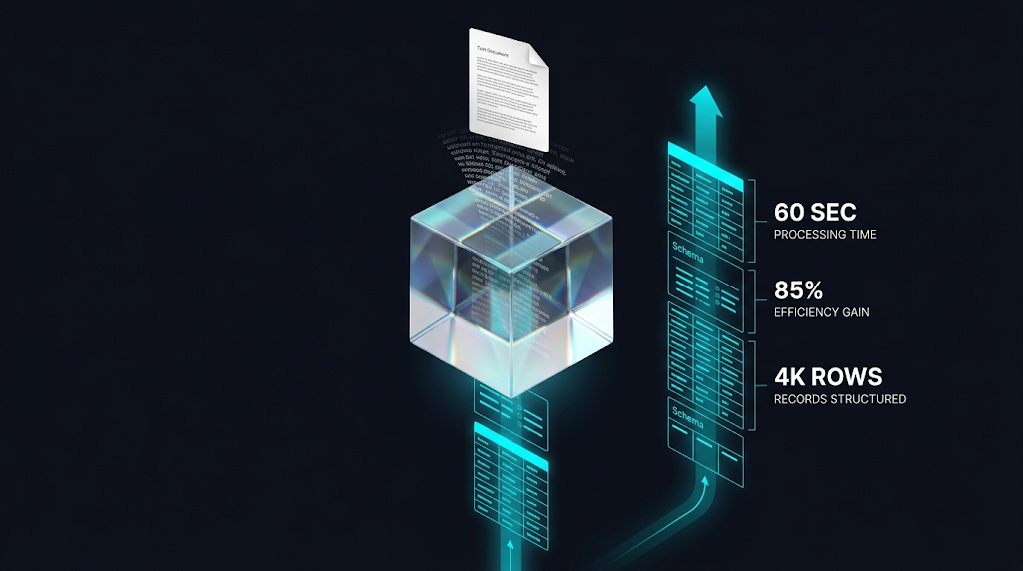
| Material Creation & Asset Pipelines | Requires 2 to 3 days per document iteration. | Moves from inception to execution within hours via collaborative automation. |
| Inbound Communication Management | Latency spans 29 to 47 hours; high response failure rates. | Continuous instantaneous response matrix, operating 24/7/365. |
| Commercial Strategy Formulation | Dictated primarily by historical instinct and subjective assessment. | Informed by continuous operational data processing. |
| Organizational Scale & Scaling Limits | Proportional headcount growth required to hit revenue milestones. | Scalable revenue generation unlocked without expanding payroll overhead. |
| Client Lifecycle Management | Inconsistent manual follow-up cadences dependent on staff bandwidth. | Algorithmic nurture sequences executed predictably across all accounts. |
Enterprise architecture tracking highlights that roughly 65% of scalable software platforms integrate specialized autonomous systems to manage functional business operations. For specialized market sectors—ranging from regional logistics firms to boutique investment operations and commercial real estate groups—this shift is monumental.
An organization operating without this layer effectively manages client relations, appointment scheduling, data validation, and ongoing audience nurturing with significant self-imposed friction.
Year 3: The Relationship Gap Becomes Structural
By the third year, the competitive divide shifts from tactical visibility and internal process efficiency into a deeply structural asset: customer relationships at scale.
The First-Party Data Moat
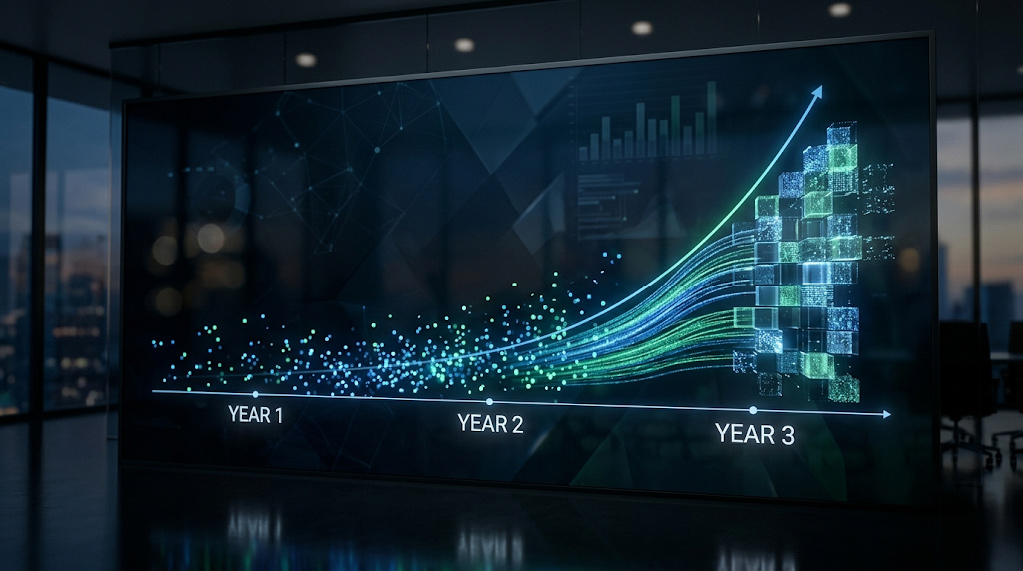
Firms using systematic business automation spend three solid years aggregating distinct, first-party customer profiles. This deep semantic infrastructure unlocks predictive analytics capabilities:
Predictive Lifecycles:
Historical Behavior Capture ──> Proactive Client Outreach ──> Locked Client Retention
These predictive models surface dynamic target accounts, recognize renewal windows before the client initiates contact, and deploy personalized touchpoints with perfect contextual timing. This drives long-term customer lifetime value well beyond standard benchmarks.
The Cost of Starting from Zero
An organization postponing adoption until the final phase enters the market at an extreme disadvantage. They must build a foundational data architecture, define behavioral models, and clean raw transaction records completely from scratch.
Strategic Asset Maturity Curve:
Automated Firm: [████████████████████] 3 Years of Iterative Machine Learning Data
Legacy Operator: [] 0 Years (Ground Zero Deployment)
While foundational platforms may grow more sophisticated over time, the historical data moat and internal process knowledge cannot be instantly purchased or simulated. That deep intelligence must be earned through consistent, structured operational runtime.
Strategic Insights: The true value generated by integrating automation is the compounding accumulation of institutional data. Multi-year operational data maps form an unreplicable competitive asset.
Overcoming Common Objections with Clear Analysis
“I need to completely master the technology before financial commitment.”
The enterprises capturing significant market share today did not delay operations to achieve total technical mastery first. They deployed functional frameworks to address core operational bottlenecks, expanding capability iteratively through real-world execution.
“Our target clientele prefers traditional interaction over automated systems.”
Your audience rarely interacts directly with the complex algorithmic layers of your business infrastructure. Instead, they interact with the outputs: immediate response times, highly relevant communications, and friction-free booking options. The machinery remains entirely invisible; the premium client experience does not.
“Our past experiments with independent marketing software yielded low ROI.”
Most businesses that experienced poor returns from independent tools failed due to a lack of core systems integration. Deploying isolated, fragmented software platforms without an overarching strategy introduces administrative friction. True automation requires a unified framework rather than a collection of separate browser tabs.
“Current budget constraints prevent infrastructure investments.”
The more precise question is to quantify the daily capital leaking through slow lead follow-ups, invisible search presence, and heavy manual administrative overhead. For most growing service and B2B operations, recovering missed opportunities via instant lead handling offsets system costs within the first quarter of deployment.
The Next 90 Days: Two Clear Pathways
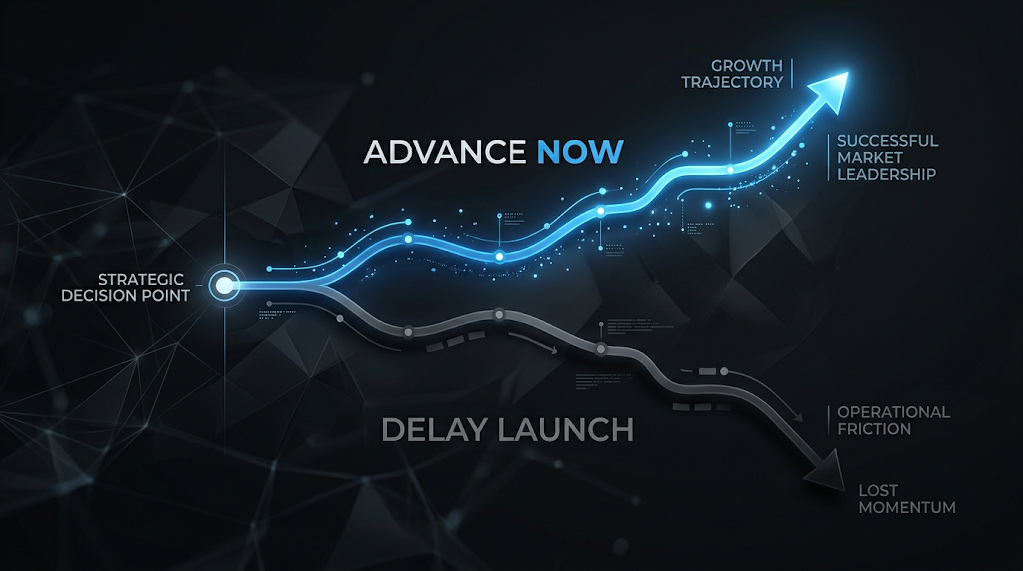
Strategic Path Choice:
├─ Advance Now ───> 30 Days: System Setup ───> 60 Days: Lead Capture ───> 90 Days: Self-Optimizing Scale
└─ Delay Launch ──> 30 Days: Lost Traffic ───> 60 Days: Competitor Gains ───> 90 Days: Permanent Asset Gap
Action Pathway A: Decisive Execution
- Days 1 – 30: Focus on building and testing your integrated data layer.
- Days 31 – 60: Seal front-end lead leaks via instant communications routing.
- Days 61 – 90: Gather clean operational data as the core system begins self-optimizing.
- Result: Your business closes the fiscal year with a defensive data moat.
Action Pathway B: Continued Evaluation
- Days 1 – 30: A direct market competitor implements an integrated automation workflow.
- Days 31 – 60: Inbound opportunities leave your ecosystem, permanently routing to the faster competitor.
- Days 61 – 90: The automated competitor establishes an accelerating data accumulation loop.
- Result: Your business enters next year facing structurally higher acquisition costs.
Within a short horizon, every scaling enterprise will rely on integrated automation engines. The core strategic challenge is deciding whether to build a compounding data asset today, or spend the next several years trying to catch up to an competitor who did.
The Core Blueprint to Optimize Your Digital Footprint
To ensure your web properties are visible to modern automated search crawlers and AI discovery engines, structure your system around this blueprint:
1. Execute Programmatic AEO Formatting
- Use clean markdown hierarchies with descriptive headings.
- Organize key data points into comparative information tables.
- Keep your paragraphs concise to facilitate quick data extraction.
2. Formulate Dense Topic Ecosystems
- Build out deep topic clusters that answer high-intent consumer questions directly.
- Use intuitive internal linking architectures to pass topical authority smoothly between web properties.
3. Implement Strict Technical Validation
- Anchor every data claim with high-quality outbound references to authoritative institutions.
- Display verified author credentials explicitly to maximize trust metrics.
A Turnkey Approach to Business Automation
Building out an enterprise-grade automation framework piece-by-piece can introduce months of internal development delays. Managing multiple disconnected platforms often leaves critical data siloed.
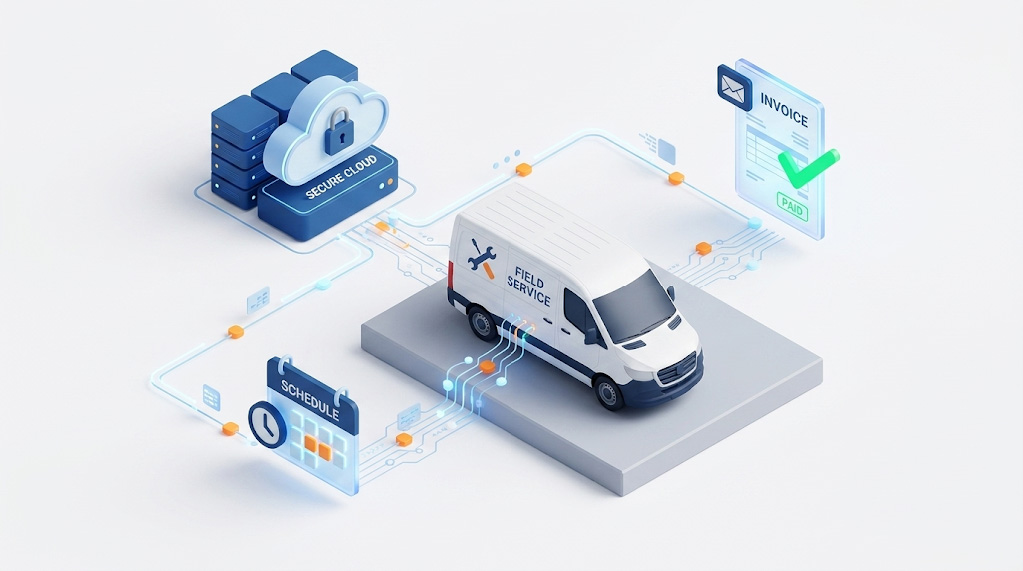
Power Reach AI replaces the friction of dealing with multiple uncoordinated software platforms by deploying a single, completely integrated operational automation system.
The entire framework integrates directly with your core data layers, optimizing your inbound funnel and going live in 5 business days.
The Integrated System Capabilities
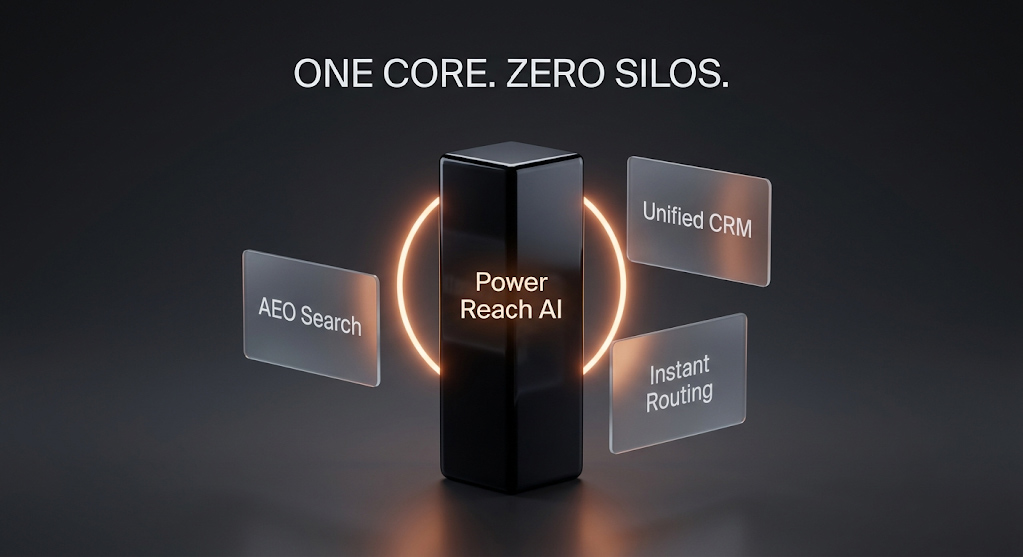
┌───────────────────────────────┐
│ Power Reach AI Architecture │
└───────────────┬───────────────┘
│
┌────────────────────────┼────────────────────────┐
▼ ▼ ▼
┌─────────────────┐ ┌─────────────────┐ ┌─────────────────┐
│ AI Optimization │ │ Unified CRM & │ │ Automated Lead │
│ & AEO Engine │ │ Data Analytics │ │ Response Matrix │
└─────────────────┘ └─────────────────┘ └─────────────────┘
- AI Search Optimization: Structures and distributes your digital assets across major answer engines, ensuring high visibility for your commercial real estate property listings or service lines.
- Unified CRM Infrastructure: Centralizes lead tracking, conversion data, and predictive indicators within a single dashboard.
- Automated Customer Response: Eliminates communication lag by routing and responding to high-intent inquiries instantly.
Eliminate the multi-week onboarding delays typical of traditional legacy setups. Book a comprehensive growth strategy session with Power Reach AI, and establish your company’s operational advantage today.